

Solana currently sells at 143.55 USD and rose 0.0165% above its closing price. The market price changed a lot throughout the day by hitting a peak at $145.65 yet dropping to $138.63. The price movements reflect combined buying strength coupled with challenge at significant support and resistance levels.
The market moves $14.83 billion during the day which shows a 11.02% growth as investors continue to show attention. As a crypto market leader Solana retains its standing with a market value that reaches $62.2 billion.

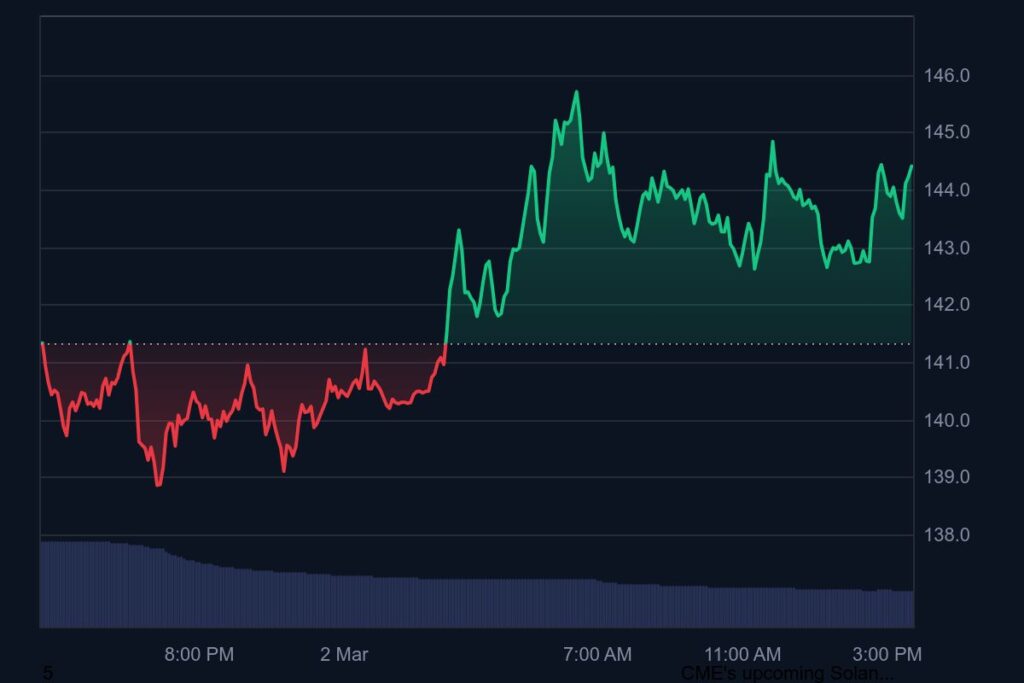
Recent Price Movement and Performance
In the past 24 hours Solana’s market value grew by 11.58% into a positive trend. The price made a significant increase from $127.97 to over $150 yet faced some selling activity which settled it around its present level. The market trend shows bulls want to push prices higher yet supply dominates above current levels.
Investors buy Solana tokens while others sell at major buying points. Purchasing pressure should push Solana higher until it tests the next resistance zones. When SOL visits prices under $140 it means investors expect a temporary reduction before another price increase.
Technical Analysis
Support and Resistance Levels
Solana attempts to find new buying and selling barriers during this trial phase. At $145 traders have begun lowering the price of SOL. SOL needs to surpass $145 to advance further toward $150, $155, and $160 as next potential barriers. These support and resistance barriers will dictate whether Solana might move higher from its current position.
Support for SOL exists at $140 and strengthens at $135 and $130 respectively. The market may shift toward $135 if investors become less upbeat about crypto and Solana cannot protect its $140 position.
Relative Strength Index (RSI) Analysis
The Relative Strength Index measurement at 70 marks the start of an overbought condition for Solana. A short-term price drop risk tends to materialize when the RSI rises near this zone. The RSI indicator stays high in buy mode when investors consistently purchase Solana.
Moving Average Convergence Divergence (MACD) Indicator
The MACD indicator indicates a market downturn as its lines cross with the MACD line below the signal line. There is a modest increase in trading pressures directed toward selling. The MACD indicator provides evidence as the histogram level indicates that buying power is weakening. A rising histogram confirms the ongoing strength of the ongoing uptrend.
Moving Averages (MA) Insights
Both 50-day and 200-day moving average lines support long-term investors because Solana remains above these levels in trading value. Solana shows investment strength because it exceeds both its 50-day MA at $130.75 and its 200-day MA at $115.50. The uptrend stays confirmed as long as the Solana price stays above its specified support levels.
Derivatives Market and Investor Sentiment
The derivatives market shows growing interest in Solana because traders want to predict upcoming price direction. Traders engaged in futures markets boosted their activity by 11.02% and placed more contracts on the market with a 10.35% rise. More traders take positions to forecast future market price movement.
Speculative activities related to options trading have jumped 45.91% to $5.11 million in recent trades. The yield escalates as traders reduce their ownership through options expiry, leading to dropped options open interest by 39.89% to $5.72 million.
Solana Price Prediction
Technical analysis shows that Solana will fluctuate between $140 and $150 today. More purchasing activity may drive Solana toward $155 and $160 levels. When selling force escalates, the price might fall to between $135 and $140 before market supporters step in.
Bullish Scenario
When Solana crosses above $145 it should reach $150 as this serves as a strong psychological resistance point. After surpassing $150 the coin has good chances to reach $155 and possibly $160. Successful price growth requires heavy buying power combined with market-wide crypto market positivity.
Bearish Scenario
When Solana cannot stay at $140 its price may drop toward either $135 or $130. Market participants should watch for when the RSI declines and MACD indicators verify a larger pullback. A market pullback is more probable in the short term before prices resume their upward movement.
Final Thoughts
The price of Solana remains in an upward movement with buying zones established between $140 and the $145 to $150 range. As long as the price extends above support at $140 while pushing through the resistance range, it has a chance to reach $155 to $160 in value. Traders must stay watchful for temporary market declines because investor feelings may evolve.