

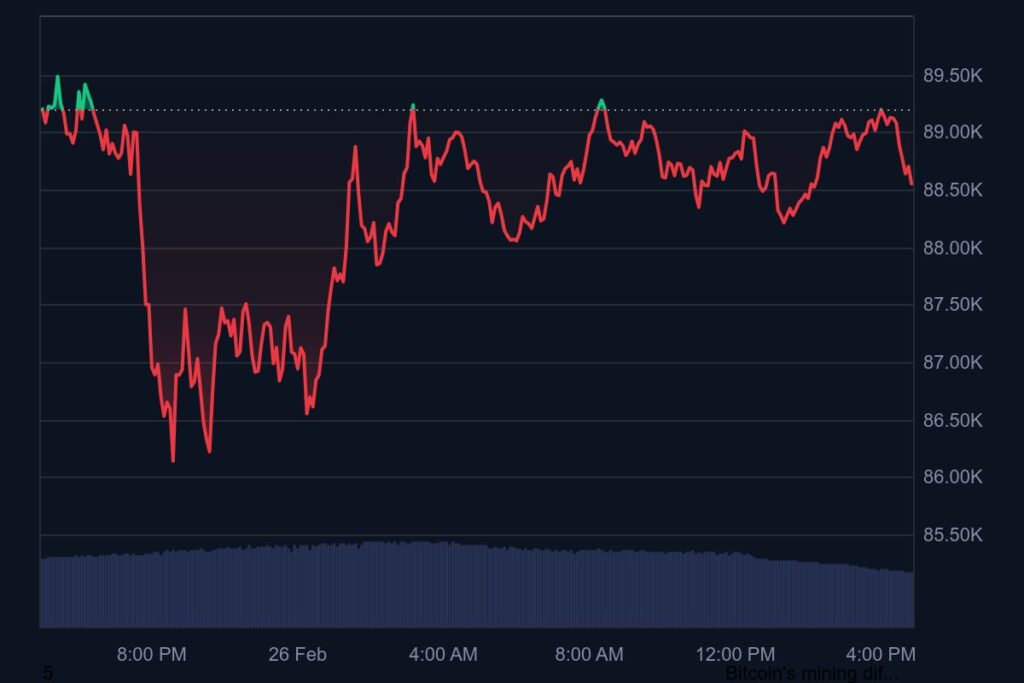
On February 26, Bitcoin hit $88,837 in price, which represented 0.011% more than its last closing value. BTC remains volatile as it tries to surpass important price barriers and shows a minimal upward trend. Bitcoin holds $1.75 trillion in market value and exchanges $38 billion throughout each 24-hour period.
During the last day Bitcoin hit $89,537 as its peak but only reached $86,015 as its lowest point. Market participants maintain their cautious approach because they need to see both economic data and the market structure for Bitcoin to decide its future direction.
Bitcoin’s Recent Price Performance
Bitcoin lost most of its value during the last month when it fell from its January 2025 $109,000 peak and settled under $90,000 recently. A fall in Bitcoin price results from the combined effects of market concerns and traders selling at specific points.
Bitcoin suffered sharp price drops because investors grew anxious over worldwide economic weakness. New Trump administration tariffs toward Mexico and Canada make business leaders worry about future trade slowdowns. After recognizing Bitcoin volatility, investors sought protection by putting their funds back into gold and US government bonds.
Technical Analysis and Key Levels
Bitcoin’s market movements formed a bearish double top pattern and led the price under $92,000 and $90,000 support areas. Bitcoin may keep falling until it defeats the essential obstacles at its current price point.
Today Bitcoin faces its first test at $85,500 which corresponds with a major bearish support area. This pullback may decline until it reaches the $80,400 target before approaching the next important obstacle at $74,000.
Bitcoin has two major barriers stopping further growth: $92,500 and $98,500. BTC is setting up to regain market momentum when it passes through all resistance at $106000.
Indicators Signaling Market Trends
Multiple technical tools show investors what Bitcoin’s market movement will likely be next. The price of Bitcoin stands below $94,500 when looking at the 50-day moving average and $89,800 according to the 200-day moving average. The current price position of Bitcoin falling below these two moving averages indicates that traders should expect short-term price declines.
The Relative Strength Indicator shows Bitcoin heading toward the oversold domain by placing at 42. When the RSI falls below 30 buyers should step in as they expect market conditions to improve.
Bears maintain market control because the MACD indicator has just moved below its signal line with falling momentum. The bitcoin price will keep falling until the indicators show bearish pressure ends.
On-Chain and Fundamental Analysis
Even during its current downturn Bitcoin shows signs that its long-term holders continue to add and keep BTC in their possession rather than sell off their positions. Based on Glassnode exchange reserve data investors are relocating their Bitcoin to personal wallets because they plan to hold it for an extended period. When investors shift Bitcoin to personal storage it usually points to rising prices ahead.
The movement of whales confirms this market development. Major Bitcoin owners keep purchasing digital assets between $85,000 and $88,000 because market recovery seems near.
Organizations still invest heavily as Bitcoin spot ETFs keep receiving ongoing funds. BlackRock’s iShares Bitcoin ETF vehicle, IBIT, invested $250 million worth of Bitcoin to confirm bigger financial institutions still purchase BTC. Expert analysts expect Bitcoin to recover through long-term institutional investing especially when BTC breaks out past the $100,000 barrier.
Short-Term Bitcoin Price Prediction
Market traders will mainly base their Bitcoin price outlook on the cryptocurrency’s engagement with critical price barriers. When Bitcoin stays above $88,000 it will try to reach $90,000 and $92,500 as barrier points before moving forward. When BTC stays above that range it would drive the price to $98,500 or potentially up to $102,500 by the end of the coming weeks.
When Bitcoin stays below $85,500 its price will likely drop toward $80,400. If Bitcoin falls below $80,400 it will enter a greater price slump and may stop at $74,000 as its most significant target.
Key Support and Resistance Levels
- Support Levels: $85,500, $80,400, $74,000
- Resistance Levels: $92,500, $98,500, $106,000
What’s Next for Bitcoin?
The bitcoin market stands near a turning point with short-term selling present yet backed by solid long-term basics. Investors keep purchasing more bitcoins and storage sites reduce their supply while institutions join the market which demonstrates a promising bounce-back is approaching.
Market participants need to watch both BTC price resistance points and global financial events to predict its future path. The Bitcoin market will resume its upward trend if it manages to go back above $90,000 and then reach $100,000. The coin may face further market pressure if buyers do not push the price above $85,000.


