

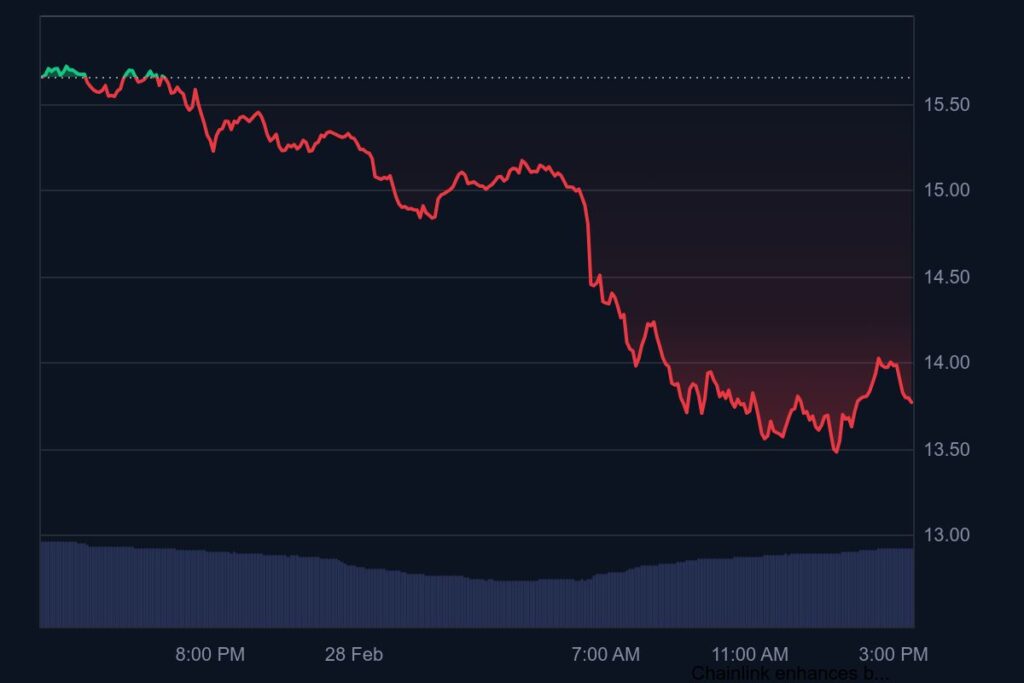
On February 28, Chainlink (LINK) sells for $13.88 after dropping 11.2% during one trading day. Chainlink (LINK) has shown powerful selling activity today, and its trading between $15.77 and $13.48 unfolded throughout the day. Traders’ buying and selling activity keeps rising during all day hours because it links with market changes.
Recent Performance and Market Sentiment
Chainlink has recorded a significant 40.65% price drop since hitting $25 in values during the previous month. The market performance of LINK over the past seven days showed a significant downturn with a 24.7% reduction plus a 10.02% loss within one day. A continuing price drop shows that investors prefer selling their LINK tokens at this time.
Related articles

The market shows no strong preference for buying or selling because the Crypto Fear & Greed Index reads 49. Chainlink maintains difficulty alongside other altcoins due to Bitcoin falling below its $80,000 price level. When Bitcoin shows signs of weakness, all cryptocurrencies tend to perform poorly including LINK and other altcoins.
Key Support and Resistance Levels
Support Levels
Buying pressure from investors exists between $13.50 and $13.80 as a primary support area for Chainlink. LINK needs to maintain its current range to avoid falling to the next critical level at $12.00 which represents important psychological support. The price movement of LINK will face an important test at $10.50 if selling continues.
Resistance Levels
To continue its positive trend, Chainlink needs to exceed $15.00 as its primary barrier. LINK will surge towards $18.00 when traders manage to cross the vital resistance level of $15.00. After crossing $20.00 there are more barrier points between $25.00 and $30.00 that may boost LINK’s price increase.
Technical Indicators
Data from the moving averages shows LINK on a bearish trend since it trades below both 50-day and 200-day averages. The market state remains dominate by selling pressure from traders.
RSI at 38 points suggests Chainlink is moving closer to its lowest price range in the market. When the RSI falls past 30 it shows that prices will likely increase because traders sold too much.
The MACD indicator shows selling strength since its signal line remains beneath the MACD line. The market indicators show Chainlink will continue its downward movement shortly.
Chainlink (LINK) Price Prediction
LINK has three possible market moves under today’s conditions.
Bearish Scenario
The selling would likely push Chainlink below $13.50 to test the price area at $12.00. If LINK fails to defend $13.50 support it may drop to $10.50 as its lowest price yet.
Neutral Scenario
Given stability between $13.50 and $14.00 LINK might establish its position and prepare to advance further. The market will closely watch for LINK to rise above $15.00 as this may point towards short-term price growth.
Bullish Scenario
Bitcoin’s recovery would help LINK buyers regain control and goal for $15.00 and $18.00 on their price charts. The crypto market would enter an upside phase when Bitcoin surpasses $18.00 and moves toward $20.00.
Short-Term vs. Long-Term Market Outlook
Chainlink shows a negative market direction now and needs to regain support above $15.00 for traders to expect price improvements.
The cryptocurrency will move upward towards $18.00 to $20.00 when LINK defends its support at $13.50.
Even though Chainlink experiences immediate market problems analysts continue to trust its strong foundations. Market improvement across 2025 creates a possibility for LINK to reach $35 before bull strength fades.
Final Thoughts
Chainlink slopes downward because of weak cryptocurrency market conditions and pressure from sellers. The market has a high chance of recovery when investors step in to buy at primary safe zones.
Watch Bitcoin and Chainlink market data plus blockchain conditions to forecast how Chainlink will move next. icro traders need to add stop-loss orders today because of intense market ups and downs.