
TRON (TRX) remains a top cryptocurrency due to its support of decentralized applications (dApps) and smart contract functions. Market observers view TRX in mixed fashion because trading activity today creates minor price reductions. This article examines TRON’s market value and trading behavior plus offers technical chart assessments to predict its future price direction.
Current Price and Market Performance
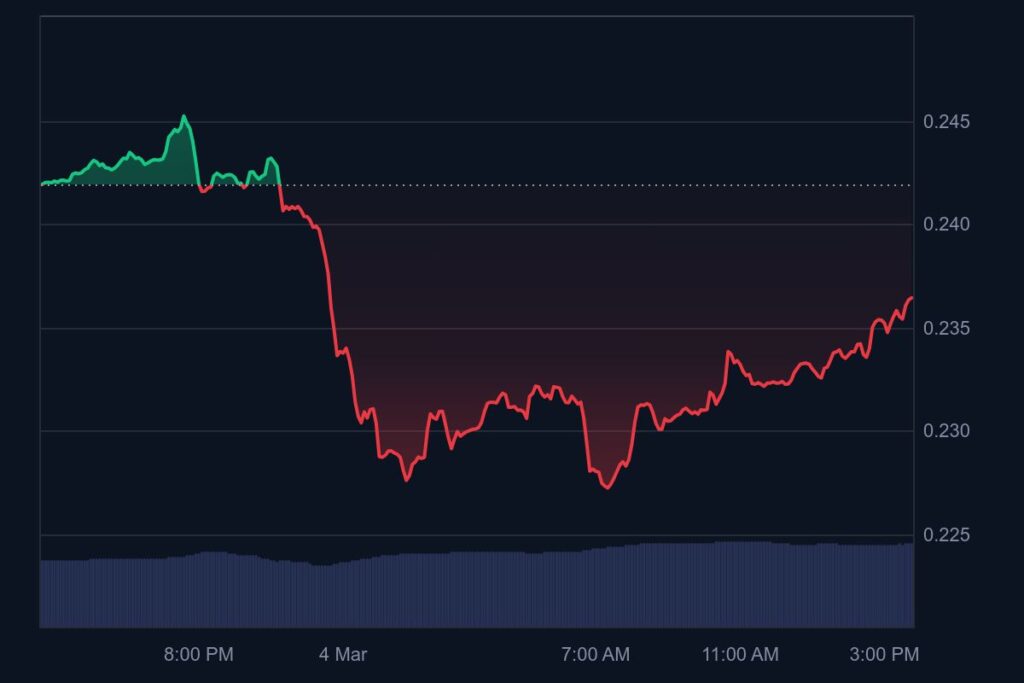
At market close on March 4, 2025 TRON (TRX) shows a decrease of 0.02562 percent with a trading price of $0.235868. TRON maintained fluctuation between $0.245274 and $0.225771 during market trading.
Related articles
TRON maintains position 11 in market capitalization rankings with $8.2 billion worth and $624 million daily trading volumes as of March 4th 2025. The market sees average investor interest that does not create large price movements.
Technical Indicators
Moving Averages
TRON’s price movement shows the 50-day Simple Moving Average at $0.241198 and the 200-day Simple Moving Average at $0.194331. When the 50-day Simple Moving Average is above the 200-day SMA both technically and visually it signifies a favorable long-term market direction. The current market value stands below the 50-day simple moving average which demonstrates bearish pressure in the short-term market.
Relative Strength Index (RSI)
TRX has a 14-day Relative Strength Index of 55.22 that classifies its market position as neutral. An asset becomes overbought when the RSI is higher than 70 while becoming oversold when the indicator displays values below 30. The equity market shows neutral conditions because the current Relative Strength Index reading of 55 rests between buy and sell activity.
MACD (Moving Average Convergence Divergence)
The MACD line stands at 0.0012 but the signal line rests at 0.0015. The MACD indicator creates a bearish signal since its lines have crossed beneath each other and this bearish move likely persists without growing buying pressure.
Bollinger Bands
TRX fluctuates between $0.250000 at the top Bollinger Band and $0.220000 at the bottom band. TRX trading movements center between these upper and lower Bollinger Bands because the market price currently sits in the middle range area. When price moves upward toward upper band a bullish breakout might happen and when price drops towards lower band it will probably result in more decreases.
Market Sentiment and Trends
TRON’s market feeling shows mild negative sentiment even though its Fear and Greed Index score of 55 puts it in the ‘Greed’ sector. TRON saw 17 daily price rises during the last 30 days for 57% of the period and experienced a total price fluctuation of 3.94%.
Investor positive expectations about TRON differ from its neutral technical trend readings. Although TRX may stay set in its current value range due to these circumstances.
Support and Resistance Levels
TRX is currently testing key support and resistance levels, which will determine its short-term direction.
- Immediate Support Level: $0.2250
- Key Support Level: $0.2150
- Immediate Resistance Level: $0.2450
- Key Resistance Level: $0.2550
TRX may drop to $0.2150 as its main breakout point when the market price decreases below this level. When the price rises above $0.2450 it will likely push TRX closer to $0.2550 and above. Buyers and traders should monitor how much people buy TRX to see if a new trading range can hold.
Short-Term Price Prediction
Based on the current technical indicators and market trends, TRX’s price is expected to see slight upward movement in the next 24-48 hours.
- March 4, 2025: Expected to trade around $0.2400
- March 5, 2025: Expected to trade around $0.2411
TRX is predicted to increase its value mildly as market conditions become more optimistic. A growth in market activity as well as happy investor attitudes may push TRX values up.
Conclusion
TRON shows defensive behavior in its price movement since it holds between $0.2250 and $0.2450 levels. Investors need to wait for both the long-term and short-term market outlook before investing in TRON. Higher market activity pushes TRX to test its resistance level, but failure to hold support makes the future price move downward.


