

After a recent rally, XRP’s rally has stalled, having failed to break through its previous high of $2.9 and now sinking back towards support levels. The rejection backlash also serves to put the question of if the bulls can reclaim the upper hand and push the price higher or if bearish pressure will continue to dominate, into focus among traders.
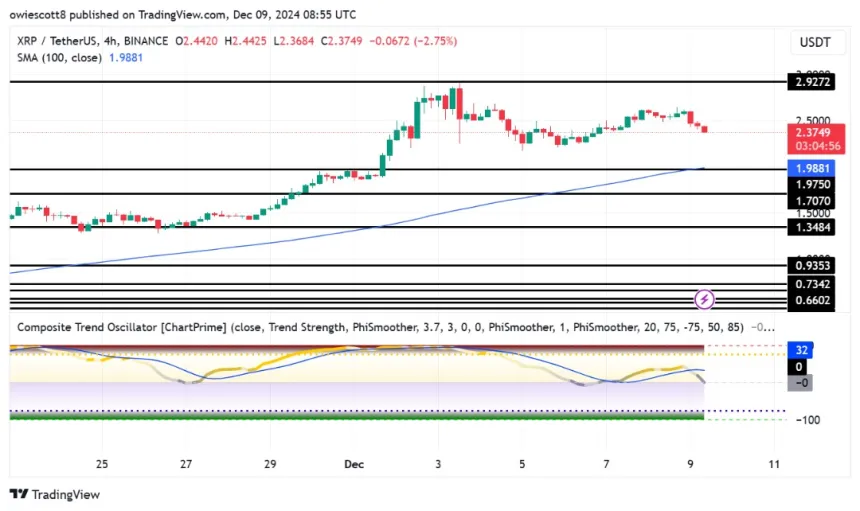
On the 4-hour chart XRP is tracing downwards and has broken the $1.9 support and is heading toward the 100 day Simple Moving Average (SMA). If prices cannot hold then this level may mean further lows ahead as pressure from selling builds.


XRP Technical Indicators Signal Bearish Shift
Another signal of growing bearish sentiment is shown in technical indicators. The composite trend oscillator on a 4 hour chart falls below the SMA, indicating maybe a shift in market momentum. The trend continues to suggest weak bullish strength as the oscillator approaches zero and the signal line can possibly turn lower indicating greater selling should the trend continue.
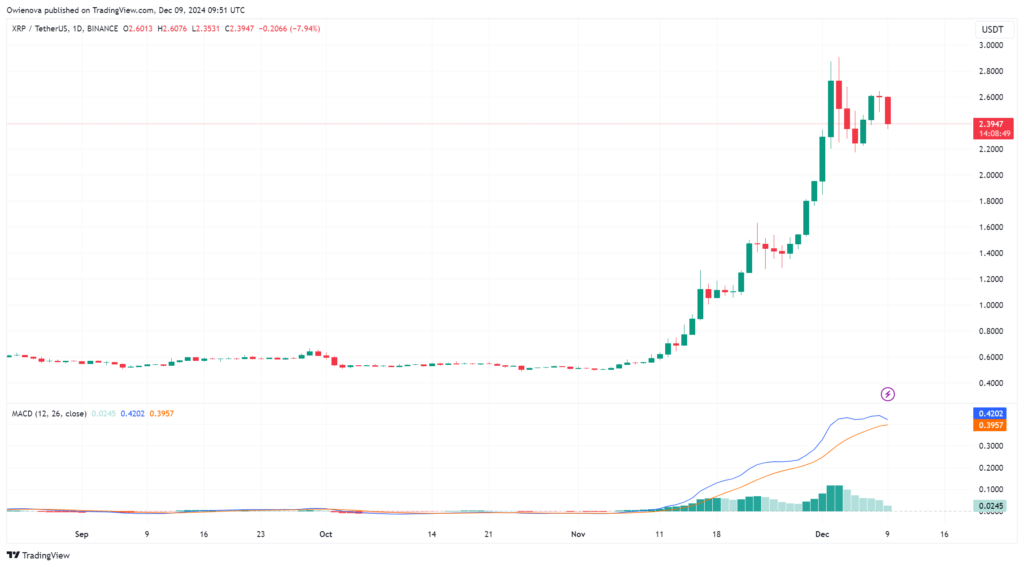
Looking at the XRP daily chart, we can see some very bearish movement with a rejection failing to gain the force of momentum above $2.9. That unsuccessful rally shows a lack of buyer confidence, which worsens a pessimistic market outlook. Further downside pressure can push the price down if the $1.9 support level breaks down.
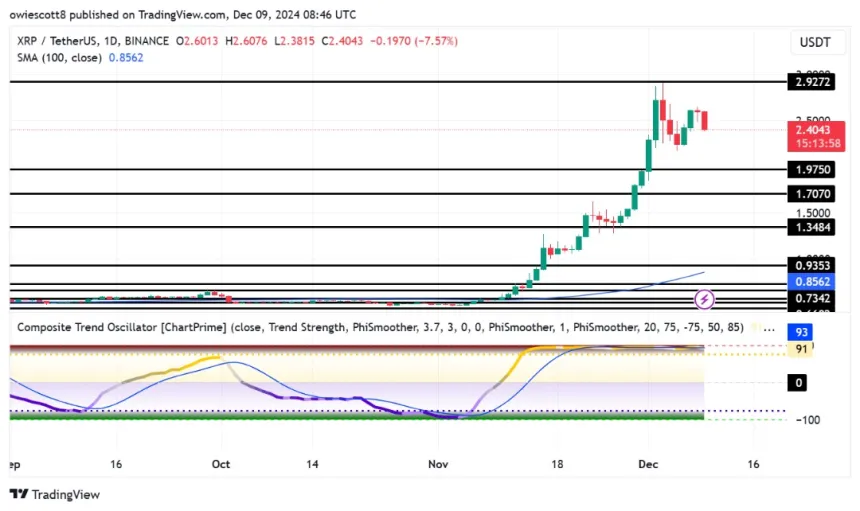
The 1 day Composite Trend Oscillator also confirms increasing bearish momentum, after the signal line dove below its SMA, which had been residing in the overbought region. This shift shows overbought conditions may be surrendering to more powerful selling pressure and is limiting the ability to recover in price.
Traders are keeping a close eye on key support levels in XRP as it continues to take the beating. The first level we’ll watch is $1.9 as this could be a critical buffer. A decline beneath this level could lead to additional drops to $1.7 and $1.3. These levels may be tested if bearish momentum is continued, as market prepares for a selloff.


